Abstract:
Abstract: The real estate industry plays a crucial role in
China's economy. However, in recent years, frequent defaults
by property enterprises have negatively impacted the stability
of China's capital market. Government measures to curb housing price inflation, including purchase restrictions and
loan controls, have further influenced the market. Along with
China's economic slowdown, reduced demographic growth, and the ongoing pandemic, the real estate sector has experienced weakened growth. National statistics from 2023 show a decline
in real estate development investment and construction activity.
This volatility has significantly affected the property market's
progress and stability. Canada's real estate market, in contrast, is recognized globally for its stability and investment appeal. Several aspects of Canada's real estate market provide valuable insights for addressing challenges faced by the Chinese real estate industry
Keywords:
Real Estate Default Risk;Bond Default Early Warning;Z-Score Model
1 Introduction
1.1 Vanke Company Overview and Current Challenges
Vanke Co Ltd (China Vanke) is a real estate development company founded in 1984 and headquartered in Shenzhen, China. Its major services include real estate investment, development, management, selling, rental, leasing, and acquisition. The company provides project management, contract management, delivery assessment, apartment building and development, office and retail real estate, city supporting services, building maintenance, and shopping facilities development services. With operations across several major cities in China, Vanke has also expanded internationally to key global markets including Hong Kong, London, New York, and more recently, Canada. In Canada, cities such as Toronto and Vancouver
represent strategic opportunities for Vanke to capitalize on the growing demand for sustainable real estate solutions, aligning with global trends in environmental innovation.
Over the past 30 years, Vanke’s revenue and net profit have grown by a staggering 4200 times. Its investment returns have exceeded 1000 times. As a result, Vanke’s stock has been beloved by value investors and created a myth of substantial long-term investment returns. In 2016, Vanke made its debut on the Fortune Global 500 list and maintained its position for 7 consecutive years. As a world top 500 company that originated in Shenzhen, Vanke has long been regarded as a benchmark in the Chinese real estate industry. From 2016 to 2023, Vanke was the only developer in China’s real estate sales ranking that consistently remained in the top three. Moreover, it stands out as the sole
player in the industry to embark on preliminary transformation. In 2018, its stock price reached an all-time high, with a market capitalization exceeding 410 billion yuan, it
even once surpassed AT&T and Simon Property Group to become the largest global real estate developer. Prior to this point, Vanke has maintained a robust financial safety margin.Vanke has made strategic overseas investments, with increasing focus on markets such as Canada, where its international partnerships and growth strategies are expected to play a key role in expanding its global portfolio. Notably, through its collaboration with the Canada Pension Plan
Investment Board (CPPIB), Vanke has actively entered the overseas real estate market, including a $250 million investment venture in China’s residential sector.
However, in the current landscape, declining performance, dim sales prospects in the real estate market sales, and ongoing liquidity challenges have contributed to the persistent decline in stock prices of publicly listed real estate companies. Vanke’s stock price has plummeted significantly, reaching a new low of 6.7 yuan as of the closing on April 19th, 2024. The company’s total market capitalization is now less than 80 billion yuan, representing only 18% of the peak market value in 2018. Notably, back in October 2023, Vanke’s multiple US dollar bonds experienced a sharp decline in prices, with some longer-duration bonds falling to less than 50% of face value. This alarming trend has been interpreted as a potential harbinger of a real estate company crisis, as a result, the prevailing pessimistic sentiment has been transmitted to the domestic bond market, leading to a continued decline of Vanke’s domestic bond prices.
As investors grapple with uncertainties, the company faces the dual challenge of restoring investor confidence and navigating the complex dynamics of the real estate sector.
In March 2024, both Fitch and Moody's downgraded Vanke's investment rating to 'BB+' and 'Ba1,' respectively. This implies that Vanke is currently classified as either 'speculative grade' or 'non-investment grade.' marking the second time within six months that these two international rating agencies have downgraded Vanke's rating. Fitch explained the rationale behind this decision, citing Vanke's poor sales
performance coupled with volatility in the Chinese capital market. These factors have further narrowed its financing avenues, meanwhile, Vanke must also address its maturing debt.
Consequently, Vanke's credit metrics, financial flexibility, and liquidity may continue to deteriorate in the future.
While Vanke, once considered a 'good student,' now faces severe challenges, it's essential to recognize that the current predicament is not unique to Vanke but rather a widespread issue across the entire Chinese real estate industry. For instance, Country Garden Holdings, after announcing a delay in publishing its 2023 annual report, has suspended trading on the Hong Kong Stock Exchange, with its stock price hovering at 0.485 Hong Kong dollars (HKD). Similarly, R&F Properties reported a loss of 19.9 billion HKD for 2023, causing its stock price to plummet to 0.76 HKD. Meanwhile, Times China
Holdings experienced a sharp decline to 0.14 HKD following Hang Seng Bank's application for liquidation. As for Sunac China Holdings, its stock closed at a dismal 0.94 HKD.
As of the end of December 2023, Vanke Group's total assets were approximately 1504.8 billion yuan. Therefore, the total inventory was 701.7 billion yuan, accounting for 46.6% of the total assets, which decreased by 22.6% compared to the end of 2022. Regarding liabilities, Vanke Group's total liabilities reached a high of 1101.9 billion yuan, including interest-bearing liabilities totaling 320 billion yuan, representing 21.3% of total assets and primarily consisting of medium- to long-term debt.
The interest-bearing liabilities due within one year were 62.4 billion yuan, accounting for 19.5% of the total interest-bearing liabilities,
while the remaining interest-bearing liabilities exceeding one year amount to 257.63 billion yuan, constituting 80.5%.
Analyzing the distribution of financing sources, bank loans account for 61.7%, payable bonds for 24.8%, and other loans for 13.5%. Notably, after excluding contractual liabilities, Vanke's net debt ratio stands at 54.66%, which falls within a relatively safe range. However, it is worth noting that Vanke's cash and cash equivalents are only 99.8 billion yuan, while short-term financial liabilities have increased from 51.1 billion to 66 billion yuan.
As a result, the company’s cash ratio has decreased from 1.8 at the end of the third quarter to 1.28. Although Vanke's cash may appear sufficient to cover short-term
In general, there are three main reasons for the challenges currently faced by Vanke. Firstly, although Vanke was the earliest in the industry to realize the need for transformation and development, it was too hasty in the actual operation process. This led to the transformation business exceeding the resource matching capacity, overusing the development business funds, and the scale was too large, resulting in management capabilities not keeping up, and the business goals were not achieved as planned. Secondly, Vanke was unable to decisively break away from industry inertia. It has made aggressive investments in many major cities and first-tier cities. When major changes occurred in macro conditions and industry conditions, Vanke still maintained the inertia of the expansion strategy and failed to adjust in time. Consequently, leading to the current difficulties such as the decline in real estate sales scale, high total debt, and the pressure
to deliver are still at its peak. Thirdly, Vanke's understanding of the trend changes in domestic financing models was not comprehensive and thorough at the beginning.
Recently, the chairman of Vanke's board of directors publicly stated that he will increase the intensity of revitalizing inventory and changing immovable property into movable property, at the same time, aiming to reduce Vanke’s interest- bearing debt by more than 100 billion yuan in the next two years to ensure company safety. Moreover, this year, Vanke broke the 31-year-old
convention and made the decision not to distribute dividends. Conveying to the market Vanke now has shifted from pursuing scale and profit to seeking safe survival.
1.2 China Real Estate Industry
The real estate industry is one of the critical pillars of China's economic development, and its stable operation is of great significance to macroeconomy and social development.
However, in recent years, the real estate industry has encountered significant challenges as seen from the policy, investment, and demand sides.
Starting from the third quarter of 2020, new financing regulations such as the "Three Red Lines" and the centralized management system for real estate loans were successively introduced. These measures aimed to restrict financing and control the risks in the industry, but also led to financial crises for many real estate companies, resulting in a wave of bond defaults and halted construction sites. Consequently, consumer enthusiasm for home purchases dampened and sales of commercial properties nationwide continued to decline. To support the industry, positive signals have been released on the policy side. In November 2022, the government introduced the "16 Financial Measures", loosening financing policies. In November 2023, the government required financial institutions to increase their support for the real estate industry, proposing the "Three Not Less Than" requirement. Meanwhile, demand-side policies have been eased, including lowering mortgage rates,
reducing down payment ratios, and implementing "Recognize the House, Not the Loan" policies in first-tier cities, supporting both rigid and improvement-oriented housing demand.
Looking at the investment side, the national real estate loan volume has been declining since 2023, coupled with the contraction of non-bank financing, leading to a continued decrease in the actual funds of real estate companies. In 2023, the investment in real estate development was 11,091.3 billion yuan, down by 9.6% from the previous year. Insufficient effective demand remains the main factor restricting funds from being
injected into the real estate sector. The weakening market sentiment has caused the real estate industry to halt its expansion, and the growth rates of new construction, ongoing
construction, and completed construction areas all remain in double-digit negative growth as of March 2024.
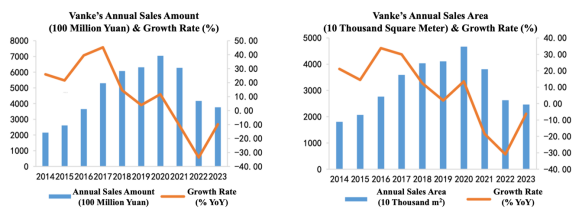
Looking at the demand side, the performance has been relatively sluggish, with sales consistently decreasing and inventory levels reaching recent highs. According to data from the National Bureau of Statistics, in 2023, the sales area of commercial properties nationwide reached 1.12 billion square meters, marking a year-on-year decrease of 8.5%; the sales amount reached 11.7 trillion yuan, indicating a year-on-year decrease of 6.5%. While new home prices in top-tier cities have generally been maintained under policy support, prices in lower-tier cities have declined, and second-hand home prices have fallen across the board. Despite current policies, their effects have not fully manifested, and the lackluster demand remains the crux of the issue. From April 1st to 16th this year, the average
daily sales of commercial housing in 30 major cities were 1939 units. The real estate market sentiment remains low, with a strong wait-and-see attitude among residents.
2.Background
2.1 Related News
Introduction
This part aims to analyze the recent news related to Vanke, a leading company in China's real estate industry, in order to evaluate the degree to
which it is affected by the current challenges it faces. The analysis will consider both negative and positive news surrounding the company.
Negative News
Fake news about negotiations with creditors
According to Chinese financial media Caixin Media, Vanke has been negotiating with creditors - a number of large state- owned insurance companies - since the end of February, to extend the repayment period of the privately raised company non-standard bond of about 5 billion yuan (about 695 million U.S. dollars). The debt has been extended for three months in two tranches, in December and January. However, the news was quickly falsified. On March 3, Xinhua Asset issued a public statement saying that recently, the company has paid attention to false information about Xinhua Asset and Vanke Enterprises. Vanke Enterprises is a leading company in China’s real estate industry and has been working with Xinhua Assets Maintain normal business cooperation. Perhaps affected by the negative news, on March 1, many domestic bonds of Vanke experienced general declines. Among them, "22 Vanke 05" fell 6.7% to a new low of 74.2 yuan, with a cumulative decline of 9.2% for the whole week, the largest weekly decline in the history of the bond; "21 Vanke 02"
fell 5.3% to a new low of 68 yuan, with a weekly decline of 9.4%. "22 Vanke 01" fell 5% to 85.7 yuan; "20 Vanke 06" fell 3.2% to 76.7 yuan, both hitting new lows.
Sale of interest in subsidiaries at a discount
On February 20, Link Real Estate Investment Trust announced that it had completed the acquisition of the remaining 50% interest in Qibao Vanke Plaza. According to the share purchase agreement, the agreed price of this transaction is 5.2 billion yuan, and the mall’s valuation is 7.06 billion yuan, a discount of approximately 26.30% . On December 8, 2023,
Banyan Tree Holdings announced that its two subsidiaries would buy the equity interests of China Vanke subsidiaries in various companies in China for 480 million yuan.
Risk of default in the offshore bond market
In the offshore bond market, Vanke has three bonds maturing in 2024 (two in US dollars and one in RMB): US$647 million on March 11, RMB 1.445 billion on May 25,
and 700 million US dollars on June 7. In recent weeks, the market has speculated that Vanke will default in the offshore market in March.
Involvement in a financial scandal
According to China Real Estate News, on April 1, Yantai Bairun Real Estate Co., Ltd. issued a report letter through the public account of Yantai Wanlin Enterprise Management Consulting Co., Ltd., making a series of serious accusations against the financial behavior of Vanke and its affiliates. The letter mentioned that Vanke was suspected of illegally establishing financial institutions to issue usurious loans and deceiving shareholders to misappropriate project construction funds. Yu Liang's gang used Vanke to misappropriate funds, issue usury, tax evasion, money laundering,
and other illegal business issues. On 2 April Hong Kong stock Vanke fell nearly 12% during the session, and A-share Vanke fell more than 5%.
Positive News
Extension of debt maturity by domestic creditors
According to China's Economic Observer, Vanke's domestic creditors have agreed to
extend its debt’s maturity for at least one year, while Vanke has committed to adding new collateral and guarantees as credit enhancements.
Syndicated loan negotiations
The South China Morning Post reported that 12 major banks, including six state-owned banks, are in talks with Vanke
to provide a syndicated loan worth up to 80 billion yuan ($11.2 billion) to enable the company to repay before the upcoming repayment deadline.
Preparation for U.S. dollar bond repayment
In response to the continued fluctuations in bonds, Vanke publicly responded on March 5 that all funds for the U.S. dollar bonds due on March 11 have been in place and debt repayment work is being arranged in an orderly manner. On March 9, the company announced that the full amount of the bond had been deposited in the
designated bank account of the agent bank. Market sentiment has calmed down and bond prices have also rebounded which marked the easing of Vanke’s short-term liquidity crisis.
Partial relief of liquidity pressure
Vanke announced on April 5 that after the communication meeting, the Shenzhen Municipal State-owned Assets Supervision and Administration Commission coordinated the docking between a number of state-owned enterprises to promote the implementation of various specific support measures, including helping to dispose of relatively low-liquidity real estate and long-term equity investments; Subscribing to the group’s SCPG’s consumer infrastructure REITs; promoting cooperation on multiple projects through industrial collaboration between Shenzhen state-owned enterprises and companies; actively coordinating
financial resources to support the company. After all the implementation is completed in the future, it is expected to help the company release liquidity exceeding 10 billion.
JPMorgan Chase & Co. held a long position of 11.7701 million shares of Vanke Enterprise’s shares
According to the latest disclosure information from the Stock Exchange, on April 8, 2024, JPMorgan Chase & Co. held a long position of 11.7701 million shares of Vanke Enterprise’s shares at an average price of HK$4.4056 per share,
involving an investment of approximately HK$51.8545 million. After increasing its holdings, JPMorgan Chase & Co.’s latest long position number is 114,087,577 shares,
and the proportion of long positions increased from 4.63% to 5.17% .
Implementation of plans to reduce debt pressure
On April 14, Vanke was surveyed by UBS Securities, CICC, Morgan Stanley, CITIC Securities, and other institutions. Vanke’s Chairman Yu Liang, President Zhu Jiusheng, and Board Secretary Zhu Xu attended the survey. In the survey, Vanke said that first of all, from the perspective of the overall operating situation, Vanke is indeed encountering periodic operating difficulties and its liquidity is under short-term pressure. However, Vanke has formulated a package of plans to stabilize operations and reduce liabilities, which can properly resolve these periodic pressures including reducing the salary of the managers.
The ultimate goal of these big plans is that Vanke's debt will be reduced by 100 billion yuan this year and next, and debt risks will be substantially resolved.
Receipt of foreign investment
According to Shanghai and Shenzhen Stock Connect, Vanke A received foreign investment to buy 736,300 shares on April 16. Hithink Royal Flush Information Network Co., Ltd (300033) data shows that on April 16, 2024, Vanke A received foreign investment to buy 736,300 shares. As of now, Mainland Stock Connect holds 219 million shares of Vanke A, accounting for 2.25% of the outstanding shares.
The cumulative shareholding cost is 34.04 yuan, and the shareholding loss is 79.23%. The capital market also expressed its affirmation of Vanke with real money.
Conclusion
Vanke has been under significant pressure to repay its debt in recent years, with negative news such as fake reports about creditor negotiations, selling interests at a discount, credit rating downgrades, and involvement in a financial scandal exacerbating the situation. However, the company and the Chinese government have taken measures to address these challenges, including extending debt maturity, negotiating syndicated loans, preparing for bond repayments, and implementing plans to reduce debt pressure. Additionally,
the company has received foreign investment, with JPMorgan Chase & Co. holding a long position in the company's shares, indicating improved investor confidence in Vanke's future.
2.2 Literature Review
In general, scholars at home and abroad believe that the frequent occurrence of bond defaults may be influenced by various factors, including macroeconomic factors, the nature of the company's industry, internal management, etc. Factors such as economic recession, low industry prosperity, high leverage levels, and frequent changes in company management can all increase the risk of corporate bond defaults. Bevan and Garzarelli (2000) argued that macroeconomics is closely related to default risk. In general, the risk of corporate default is relatively high in a macroeconomic downturn. Hsu (2015) found a significant negative correlation between a company's bond default risk and innovation capability. Furfine and Rosen (2011) found that mergers increase the default risk of acquiring companies.
Huang Haijie and Chen Yunjia (2022) found that highly uncertain economic policies can have a huge impact on companies, increasing the likelihood of corporate bond defaults.
On this basis, experts propose a series of measures to reduce bond default risk, including central bank intervention in adjusting interest rates, implementing partial debt relief, strengthening corporate liquidity management, and enhancing corporate governance capabilities. John Geanakoplos (2014) believes that regular monitoring and forecasting of the entire credit
surface by central banks, and intervention in extreme cases to adjust risk interest rates and implement partial debt relief, can help reduce default risk.
In terms of credit measurement models, foreign scholars often independently develop models to evaluate default risk, while domestic scholars mostly test whether foreign risk measurement models are suitable for China's actual condition and modify the models to make them more suitable. Altman (1968) used the principles of mathematical statistics to select 5 important indicators based on 22 financial indicators and construct a 5-variable Z-score model to measure the financial situation of both non-bankrupt and bankrupt enterprises in the United States. This model divided the calculation results into three levels, with each level corresponding to different Z-values. The KMV model was first proposed as a credit risk prediction model by Kealhofer, Mcquown, and Vasicek (1974).
Wang Chuanpeng and Li Chunlei (2018) found through an independent sample T-test that short-term debt+0.8 times long-term debt is the optimal default point of the KMV model.
We used qualitative and quantitative methods for our research. Qualitative analysis focuses on the external environment and internal mechanisms. Quantitative analysis is based on the financial data of Vanke in recent years,
using the Z-score model and KMV model to measure the credit risk of Vanke, analyzing the financial status and credit risk level of the enterprise.
3.Data Analysis: Qualitative Analysis
3.1 Performance
Table 1: Vanke’s Overall Performance
Project 2023 YoY Change 2022 YoY Change 2021
Operating Income 4, 657.39 -7.56% 5,038.38 11.27% 4, 527. 98
Real Estate Development and Related 4, 297.46 -8.65% 4,704.46 9.42% 4, 299. 32
Property Service 294.27 14.17% 257.74 29.97% 198.31
Other 65.66 -13.81% 76.18 151.00% 30.35
Gross Profit Margin 15.23% Down 4.32 Percent 19.55% Down 2.27 Percent 21.82%
Operating Profit 292.52 -43.78% 520. 29 -0.96% 525.31
Gross Profit 298.05 -43.13% 524.08 0.35% 522.23
Net Profit Attributable to Shareholders of Listed Companies 121.63 -46.39% 226. 89 0.73% 225.24
Non-net Profit Withheld 97.94 -50.62% 198.33 -11.39% 223.82
Net Cash Flow from Operating Activities 39.12 42.24% 27.5 -33.13% 41.13
Return on Equity (Weighted Average) 4.91% Down 4.57 Percent 9.48% Down 0.3 Percent 9.78%
Total Assets 15,048.50 -14.36% 17, 571.24 -9.36% 19, 386.38
Total Liability 11, 019.17 -18.51% 13, 521.33 -12.53% 15,458.65
Net Asset Attributable to Shareholders of Listed Companies 2, 507.85 3.33% 2,426.91 2.86% 2, 359. 53
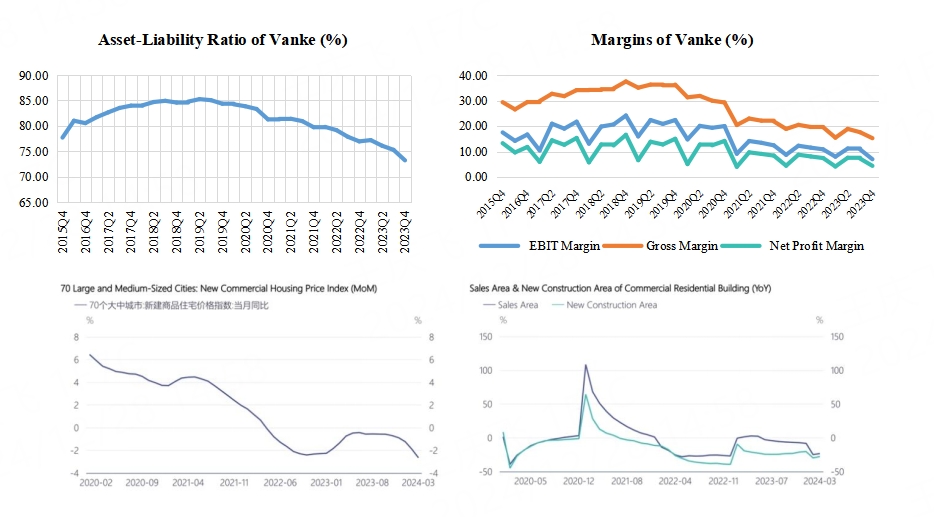
Asset-liability Ratio 66.26% Down 2.35 Percent 68.61% Down 1.18 Percent 69.80%
Net Debt Ratio 54.66% Up 11.05 percent 43.61% Up 13.92 Percent 29.69%
Cash Short Debt Ratio 1.6 -24.81% 2.13 -16.53% 2.55
From the latest annual report released by Vanke, we can see that the company has maintained positive operating cash flow for fifteen consecutive years, with a year-on-year increase of 42.24% compared to the previous year. However, due to the overall downturn in the real estate industry, Vanke's operating revenue decreased by 7.56%, gross profit margin decreased by 4.32 percentage points, and net profit decreased by 50.62%. The weighted average return on net assets also decreased by 4.57 percentage points compared to the previous year. Overall, although Vanke has performed well in terms of operating cash flow, it faces significant market pressure and competition in an economic downturn, leading to a significant decline in performance. Additionally, the decline in weighted average return on net assets indicates a decrease in the company's asset profitability.
In summary, while Vanke has shown strong performance in operating cash flow, it still faces challenges and pressure in terms of financial performance and asset returns.
3.2 Interest-bearing Debt
Table 2: Interest-bearing Debt
Project 2023 2022 2021 2020
Interest-bearing Debt 3, 200.5 3,141.10 2,659.60 2, 585.3
Short-term Interest-bearing Debt 624. 2 645.2 586.2 829.1
Long-term Interest-bearing Debt 2, 576.3 2, 495.9 2,073.40 1,756.20
Short-term Proportion 19.50% 20.54% 22.04% 32.07%
Long-term Proportion 80.50% 79.46% 77.96% 67.93%
Banks Proportion 61.70% 60.60% 56.10% 52.70%
Bonds Proportion 24.80% 27.30% 21.80% 21.90%
Other Proportions 13.50% 12.10% 22.10% 25.40%
Interest Expense 142.6 120.4 134.5 158.4
Capitalization 94.2 71.4 67 80.6
Based on the annual reports of Vanke since 2020, there has been a slight increase in interest-bearing debt in 2023, following significant growth in 2022. The proportion of short-term debt has been reduced to less than 20%, indicating an improvement in the maturity structure. In terms of debt sources, the proportion of bank borrowings continues to rise, while non-standard (other) debt has noticeably decreased, leading to an optimized debt structure. However, it is worth noting that the proportion of bonds at the end of 2023 is about a quarter, which, although lower than in 2022, still requires a further reduction in the current volatile capital market.
Regarding interest expenses, they have been continuously compressed as interest-bearing debt increased from 2020 to 2022, reflecting Vanke's excellent financing capability.
However, in 2023, despite a mere 1.89% growth in interest-bearing debt, interest expenses increased by 18.44%. This suggests an increase in the cost of existing debt. Vanke plans to reduce interest-bearing debt by 100 billion yuan in the next two years and actively utilize financing
tools such as operating property loans to fully integrate into the urban real estate financing coordination mechanism and promote financing model transformation.
Additionally, at a performance meeting, Vanke's management mentioned that since a positive statement from Shenzhen State-owned Assets in November 2022, they have taken four
measures to help and support Vanke: disposing of low-liquidity properties and long-term equity investments, subscribing to profitable consumer infrastructure projects through
market- oriented means, promoting project cooperation through industrial synergy between Shenzhen state-owned enterprises and Vanke, and actively coordinating financial
resources to support Vanke. In conclusion, Vanke has taken active measures to ensure debt security, but attention should still be paid to the increasing cost of existing debt
and a further reduction in the proportion of bonds.
3.3 Bonds and Guarantees
Table 3: Overview of Domestic and Overseas Debt
Overview of Domestic Debt Overview of Overseas Debt
Domestic Liabilities(CNY) 64.016 billion Foreign Debt (USD) 2.594 billion
Peak Payment in the Next 12 Months 5.149 billion (February 2025) Peak Payment in the Next 12 Months 614 million (June 2024)
Average Par Value of Principal Bonds 3.10% Average Par Value of Principal Bonds 3.66%
Main Bond Financing Cost 4.68% Main Bond Financing Cost 4.48%
Principal Bond Duration 1.24 Principal Bond Duration 2.12
Note: Different currencies are converted into US dollars according to the central parity of the previous trading day
As of the end of 2023, Vanke Corporation faces significant debt pressure. The total amount of domestic bonds is CNY 64.016 billion, while the overseas debt stands at USD 2.594 billion, totaling
approximately CNY 82.77 billion. Moreover, the total principal to be repaid in 2024 amounts to CNY 22.49 billion, with increasing debt repayment pressure in the second quarter.
Although Vanke had CNY 99.814 billion in cash on hand and cash equivalents of
CNY 96.943 billion at the end of 2023, it is important to consider the exclusion of funds under pre-sales supervision, which may put pressure on the bond coverage.
To alleviate the debt pressure, Vanke plans to obtain over CNY 30 billion in additional financing through operating property loans. This is an important measure to provide funding support and increase the safety cushion for the company. Additionally, the company will focus
on strengthening bulk transactions and equity transactions to realize over CNY 30 billion in receipts. These initiatives aim to enhance liquidity and mitigate debt risks.
However, despite cash received from sales of goods accounting for approximately 73.92%, 77.59%, and 78.87% of the sales amount in 2021, 2022, and 2023 respectively, further measures need to be taken to address the debt challenges.
The company needs to closely monitor market conditions and implement appropriate business strategies to ensure sufficient cash flow and timely debt repayment.
3.4 Company Abbreviation
Table 4: Company Abbreviation
Company Abbreviation Income YoY change Net profit YoY change NCF from OA. YoY change Gross Profit
(%) YoY change
Vanke A 4,657.39 -7.56% 121.63 46.23% 39.12 42.24% 15.24 -4.32
China Merchants Shekou 1750.08 -4.37% 63.19 48.20% 314.31 41.75% 15.89 -3.36
Xincheng Holdings 1,191.74 3.226 7.37 47.12% 101.58 -30.11% 19.05 -0.98
Gemdale Group 981.25 18.37% 8.88 -85.46% 21.93 -88.99% 17.41 -3.25
OCT A 557.44 -27.39 -64.92 40.47% 34.23 695.59% 18.97 -3.86
Analyzing Vanke's performance from an industry perspective and comparing it with other large real estate companies that have published their 2023 annual reports, as shown in the table above, Vanke's revenue and profit scale are outstanding, with a profit decline similar to that of Xin Cheng Holdings and better than that of Gemdale Group. However, its operating cash flow is significantly lower than that of China Merchants Shekou and Xin Cheng Holdings. Apart from OCT A's change from negative to positive, which caused
a significant year-on-year change, Vanke's year-on-year change is considered excellent. Its gross profit margin is also relatively low, with the most significant decline.
Table 5: Comparison of the Asset-liability Ratio
Company Abbreviation Asset-liability ratio
Vanke A 66.26%
China Merchants Shekou 60.27%
Xincheng Holdings 67.64%
Gemdale Group 62.02%
OCT A 73.33%
From the perspective of debt, Vanke's asset-liability ratio, excluding prepayments and contract liabilities, has been continuously decreasing,
which is a positive aspect. However, due to the "resilience" of debt and cash consumption, the net debt ratio and cash short-term debt ratio have been consistently weakening.
In summary, the decline in Vanke's performance is not significantly related to its debt. The key issue is when the sales will recover. This not only affects Vanke's cash flow but also has an impact on improving market sentiment, which can benefit a series of activities such as refinancing. However, sales are not only
Vanke's business but also depend on the overall trend of the industry. Therefore, the direction of the real estate industry is crucial for Vanke's future performance.
4.Data Analysis: Z-Score Model
The Altman Z-Score model, developed by American finance professor Edward Altman (1968), is a tool designed to predict the probability of a company going bankrupt within the next
two years. It is specifically designed for publicly traded manufacturing companies with assets greater than $1 million. The model evaluates five fundamental price points available from the company's current public disclosure documents to determine the Altman Z Score. The Altman’s Z-score formula is as follows:
Z = 1.2X1 + 1.4X2 + 3.3X3 + 0.6X4 + 0.99X5
Where:
X1 = Working Capital/Total Assets
X2 = Retained Earnings/Total Assets ratio
X3 = Earnings Before Interest and Tax/Total Assets
X4 = Market Value of Equity/Total Liabilities
X5 = Total Sales/Total Assets
To derive the critical value of default risk, Altman calculated the z value of 66 American companies, half of which went bankrupt and half of which remained operational. Companies with Z-Scores above 2.99 are generally considered stable and healthy, with
a low probability of bankruptcy. Scores that fall between 1.81 and 2.99 lie in a grey area, while Z-Scores less than 1.81 indicate companies face a high probability of default.
However, the Altman Z-Score model's applicability is weak in the financial analysis and risk assessment of listed real estate companies in China due to the difference in macroeconomic situations and the particularity of the real estate industry. Xiao Pei (2015) adjusted the critical value to 1 and 1.6 to make the model more applicable to Chinese-listed real estate firms.
By applying the financial data of listed real estate firms in 2011, the new critical value has an 81% accuracy rate in predicting the default of real estate companies in China.
After calculating Vanke’s competitors’ Z-Score, we observe that all the following eight companies have a Z-Score below to 1, hence falling into the distress zones. That fits how the real estate industry
and firms in China have behaved in recent years. To some extent, it indicates that the Altman Z-Score model can predict the credit risk of the Chinese real estate industry.
Table 6: Vanke’s Competitors’ Z-Score
Competitive Companies Altman Z-Score
Shanghai Lujiazui Finance & Trade Zone Development Co Ltd 0.58
Shanghai Zhangjiang Hi-tech Park Development Co Ltd 0.98
Longfor Group Holdings Ltd 0.89
Seazen Holdings Co Ltd 0.57
Hangzhou Binjiang Real Estate Group Co Ltd 0.68
China Green Electricity Investment of Tianjin Co Ltd 0.91
Zhuhai Huafa Properties Co Ltd 0.81
China Merchants Shekou Industrial Zone Holdings Co Ltd 0.74
Next, taking Vanke, one of the most renowned Chinese real estate firms, as an example, its Z-Score for the past five years is below 1, indicating a dire financial situation and a high likelihood of default in the next two years. From 2019 to 2021, Vanke's Z-Score remained at around 0.7 and later increased slightly to 0.8 in 2022 and 2023. The working capital/total assets ratio, which indicates a company's ability to meet its short-term financial obligations, increased from 0.098 in 2019 to
0.218 in 2023. This is a positive sign, but Vanke must find a way to sell its fixed assets to repay its debt, which is due in these years.
Table 7: Vanke's Z-Score Model Result
Year Factor Z-Score Zones
X1 X2 X3 X4 X5
2019 0.098266 0.055117 0.049592 0.249112 0.212655 0.72 Distress Zones
2020 0.123049 0.052654 0.047311 0.219458 0.224223 0.73 Distress Zones
2021 0.149074 0.047817 0.030993 0.143788 0.233565 0.67 Distress Zones
2022 0.191716 0.055759 0.033163 0.156548 0.286629 0.80 Distress Zones
2023 0.218095 0.062210 0.023619 0.113253 0.309492 0.80 Distress Zones
The retained earnings/total asset ratio for Vanke did not change too much in the past five years and remained around 5%. The EBIT/total assets ratio demonstrates a firm's ability to make a profit and support its operation and debt repayment. As shown in the table, Vanke's earning power of its assets decreased,
and the EBIT/total assets ratio decreased by more than half from 4.96% in 2019 to 2.36% in 2023, influenced by the economic recession and lower demand for real estate.
Vanke's market capitalization dropped by over 80% from 2018, indicating an irrational capital structure and decreasing investor confidence in the firm's financial strength. The market value of equity/total
liabilities ratio also declined significantly from 25% in 2019 to 11.3% in 2023, close to the point where liabilities exceed assets, and the firm becomes insolvent.
The capital-turnover ratio indicates a company's ability to utilize its assets to generate revenues, and this ratio increased from 21% in 2019 to 31% in 2023, indicating an increased efficiency of Vanke's management. Overall, the final Z-Score result indicates that Vanke fell into the distress zone in the past five years and has more than an 80% chance of bankruptcy in two years. Moody's, S&P,
and Fitch have all downgraded Vanke's credit rating to below investment grade. However, with government support, it remains to be seen whether Vanke can survive the recession.
5.Data Analysis: KMV Model
5.1 Introduction
The KMV model is an advanced methodology developed for assessing the probability of corporate debt default. It was launched in 1993 and widely promoted by KMV Corporation in 1997[ Bharath, Sreedhar T., and Tyler Shumway. Forecasting default with the KMV-Merton model. AFA 2006 Boston Meetings Paper. 2004.]. This model builds upon the foundational principles of the Merton model[ Merton, Robert C. On the pricing of corporate debt: The risk structure of interest rates. The Journal of finance 29.2 (1974): 449-470.]. It posits that default
occurs when a company’s asset value dips below its debt obligations, specifically at the “default point (DP).” Fundamental to the KMV model are several key assumptions:
(1) Both the asset and equity values of a company adhere to a geometric Brownian motion, exhibiting log-normal distributions in returns.
(2) Default is triggered when the asset value falls short of the debt value.
(3) There is long-term efficiency within the stock market.
Utilizing the Black-Scholes-Merton pricing framework, the model allows for the estimation of the market value of a firm’s assets and the volatility by examining the fluctuations in equity value. By convention, DP is determined as 100% of short-term debt plus 50% of the book value of long-term debt. This threshold aids in calculating the default distance, assuming that asset value volatility follows a normal distribution. From the DD, the expected default frequency (EDF) can be deduced, thereby estimating the company’s
likelihood of default. This model provides a robust framework for credit risk analysis, particularly in determining the financial stability and risk profile of corporations.
5.2 Methodology
Table 8: Meaning of Each Variable
Variable Meaning Variable Meaning
Market value of equities D Face value of debts
Volatility of N() Standard normal CDF
Market value of assets T Time to maturity of debts
Volatility of r Risk-free rate
Due to the immature bond market in China, default events appeared far later, and the scale of defaults is relatively small, making China’s bond default database less comprehensive. Therefore,
this paper will only assess the credit risk level of Vanke by calculating its DD, but will not go further to calculate EDT. The process is divided into the following two steps:
(1) Calculate and by B-S-M formula
(2) Calculate the default point (DP) and the default distance (DD)
While the coefficient of the short-term debt (STD) is 100%, a weight of 50% on the book value of the long-term debt (LTD) was derived from a large number of default data
on the US corporate bonds, but this may not suit China’s capital market. Yu Miaozhi and Hua Siyu used a genetic algorithm to improve the KMV model, concluding that a value of
0.7127 works better for the Chinese real estate industry[ Yu Miaozhi, Hua Siyu. Research on corporate bond default risk measurement based on Genetic algorithm KMV model [J].
Science & Technology and Economy, 2019, 33(03):51-55.]. Thus, we employed this adjustment in our later analysis.
5.3 Data Processing
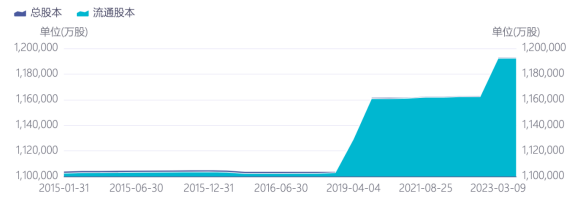
This paper takes the listed real estate company Vanke (000002.SZ) as the subject of study, examining its quarterly financial statements from the fourth quarter of 2015 (2015Q4) to the fourth quarter of 2023 (2023Q4), covering a total of 33 quarters. Through the RoyalFlush Information ( 同 花 顺 ) iFind platform, data on Vanke’s (1) current liabilities and (2) long-term debt values for each quarter,
(3) circulating and (4) non-circulating share counts, (5) net assets per share, and (6) the average closing stock price for each quarter were collected.
(1) Calculate the benchmark for the risk-free rate
The benchmark for the risk-free rate was the annualized three-month Shanghai Interbank Offered Rate (SHIBOR). Since the data frequency is daily, we averaged the rates in each
quarter to derive the proxy of the risk-free rates in each quarter.
Table 9: Annualized 3-Month SHIBOR in Each Quarter
Date Rate (%) Date Rate (%) Date Rate (%)
2015Q4 3.075573 2018Q3 3.107748 2021Q2 2.524306
2016Q1 2.944125 2018Q4 3.042089 2021Q3 2.38603
2016Q2 2.910623 2019Q1 2.872825 2021Q4 2.467197
2016Q3 2.830966 2019Q2 2.867065 2022Q1 2.418383
2016Q4 2.977547 2019Q3 2.665139 2022Q2 2.138677
2017Q1 4.077695 2019Q4 2.937966 2022Q3 1.731178
2017Q2 4.473503 2020Q1 2.515169 2022Q4 2.030081
2017Q3 4.337367 2020Q2 1.605113 2023Q1 2.41277
2017Q4 4.605 2020Q3 2.534746 2023Q2 2.291887
2018Q1 4.696493 2020Q4 2.93541 2023Q3 2.107984
2018Q2 4.190203 2021Q1 2.713625 2023Q4 2.45934
(Source: iFind)
(2) Calculate DP, and DD
There are two main methods for calculating equity value:
(1) Equity Value = Stock Price * Quantity
(2) Equity Value = Book value per Share (BPS) * Number of Non-tradable Shares + Closing Price of Tradable Shares * Number of Tradable Shares
We observed that the number of tradable and total shares of Vanke were not the same. For the sake of precision, we used the second method to find out .
Table 10: Daily Logarithmic Returns of Vanke
Date BPS (¥) Total number of NON-tradable shares Market value of tradable shares (¥) (¥)
2015Q4 9.08 1,330,353,726 163,224,597,840.92 175,304,209,669.43
2016Q1 9.12 1,330,823,110 237,214,172,264.82 249,351,279,030.03
2016Q2 8.83 1,330,808,176 237,174,839,634.34 248,925,875,832.18
2016Q3 9.10 1,331,044,242 211,717,144,413.58 223,829,647,015.78
2016Q4 10.28 1,331,044,242 240,791,814,764.44 254,474,949,572.20
2017Q1 10.32 1,330,084,242 201,942,026,968.38 215,668,496,345.82
2017Q2 10.20 1,330,082,620 201,532,778,163.68 215,099,620,883.26
2017Q3 10.54 1,329,986,896 237,436,885,783.92 251,454,947,667.76
2017Q4 12.02 1,329,986,896 281,538,278,743.87 297,524,721,233.79
2018Q1 12.34 1,323,981,958 336,385,292,780.39 352,723,230,142.11
2018Q2 12.22 1,323,981,958 273,192,200,804.17 289,371,260,330.93
2018Q3 12.68 1,323,981,958 226,196,482,516.79 242,984,573,744.23
2018Q4 14.11 1,323,981,958 234,422,195,552.57 253,103,580,979.95
2019Q1 14.27 1,323,981,958 264,125,322,941.45 283,018,545,482.11
2019Q2 14.25 1,573,823,408 279,254,466,911.00 301,681,450,475.00
2019Q3 14.80 1,586,972,958 270,323,859,125.70 293,811,058,904.10
2019Q4 16.64 1,586,972,958 270,828,680,433.13 297,235,910,454.25
2020Q1 16.69 1,586,972,958 284,875,586,129.84 311,362,164,798.86
2020Q2 16.84 1,651,175,085 254,761,019,172.96 282,566,807,608.64
2020Q3 17.45 1,908,123,705 272,287,365,585.95 305,584,124,242.43
2020Q4 19.32 1,903,363,294 281,111,156,485.24 317,884,135,322.10
2021Q1 19.43 1,905,590,373 295,006,028,981.28 332,031,649,919.96
2021Q2 19.10 1,900,178,936 262,158,532,390.96 298,451,950,068.56
2021Q3 19.58 1,903,167,676 211,962,612,225.12 249,226,635,318.14
2021Q4 20.30 1,907,830,110 190,747,605,384.36 229,476,556,617.36
2022Q1 20.38 1,907,830,110 190,144,034,912.34 229,025,612,554.14
2022Q2 20.28 1,907,833,373 183,887,334,695.12 222,578,195,502.31
2022Q3 20.73 1,910,071,133 169,729,402,599.14 209,325,177,195.80
2022Q4 21.00 1,913,348,731 164,542,449,850.30 204,722,773,201.30
2023Q1 20.62 2,000,482,934 167,418,176,114.45 208,668,134,212.83
2023Q2 21.03 2,214,042,256 144,239,807,574.80 190,801,116,218.48
2023Q3 21.20 2,214,042,256 136,496,400,931.97 183,434,096,759.17
2023Q4 21.15 2,214,042,256 111,021,020,154.05 157,848,013,868.45
For , we first calculated the daily logarithmic returns of the stock, then calculated the standard deviation of the daily returns. Multiply the resulting standard deviation
by the square root of the number of trading days in a year (assume 250 days) to obtain . Note that, when calculating the , we excluded the trading days which had zero
trading volumes and the day following to filter out the suspension days of trading (especially in 2016) and avoid the underestimation of the volatility.
Then, we derived the values attached in Appendix 1.
(3) Results and Discussions
From the results of DD, no matter whether we set the coefficient to be 0.5 as usual or 0.7127,
we found that the KMV model failed to capture the issue encountered by Vanke. We would like to explain this outcome from two perspectives.
However, in publicly listed real estate companies, the parameters of the market value of equities, corporate debt, long-term liabilities, and short-term liabilities are characterized by their large magnitudes (as large as ). Furthermore, the value of these liabilities is significantly influenced by the sales models typical of the real estate sector. Most of these companies hold substantial advance payments, classified as contract liabilities, which serve to further inflate the value of liabilities. Given these conditions, minor fluctuations in stock prices exert a
negligible impact on the overall asset value of these companies. Consequently, this model may not provide an accurate or feasible method for evaluating such firms.
From the firm’s idiosyncratic side, such results indicated that Vanke’s crisis may be less related to the deterioration of its current debt structure. It is more due to the systematic trouble of China’s real estate industry: the sharp decline in sales prices and areas.
This indeed, to some extent, echoed our analysis before. In a word, the plight of Vanke is more of the downward beta of the industry than the alpha of Vanke itself.
The fundamental reason constraining the healthy development of real estate companies is the continued inability of real estate sales to return to historical levels. As risks in the real estate industry are further mitigated and supportive policies continue to be implemented, the financing environment for Vanke may gradually improve. However, whether sales can warm up depends on whether the entire real estate industry can revive and whether
there will be a significant repair in demand across the industry. Under this circumstance, it is very hard for us to use the KMV model to predict the potential credit risk.
6.Insights from Canada's Real Estate Market
6.1 Stringent Regulation and Oversight
Canada's real estate market benefits from strict regulatory frameworks aimed at ensuring market stability. Provincial authorities, such as the Ontario Real Estate Association and British Columbia's Financial Services Authority, enforce regulations to oversee transactions, prevent fraud, and ensure ethical practices. The federal government, through the Canada
Mortgage and Housing Corporation (CMHC), supports stability by implementing policies to prevent market overheating and managing risks associated with mortgage lending.
Application in China: Strengthening regulatory oversight and enhancing transparency in real estate transactions can help restore investor confidence and stabilize the market.
6.2 Focus on Affordability and Housing Supply
Canada prioritizes affordable housing and increasing housing supply to meet demand. Programs such as the National Housing Strategy focus on creating more affordable housing units, reducing homelessness, and addressing the housing
needs of low-income families. Additionally, initiatives like zoning reforms in major cities aim to expedite housing development and address supply shortages.
Application in China: China could consider similar policies to address imbalances in
housing supply and demand, especially in urban centers, while ensuring that affordable housing is accessible to lower-income groups.
6.3 Foreign Investment Regulation
Canada's government has implemented measures to manage foreign investment in real estate to prevent speculative activities that drive up housing prices. The Prohibition on the Purchase of Residential Property by Non-Canadians Act, effective January 1, 2023,
restricts foreign buyers from purchasing residential properties in certain areas to stabilize the market and make housing more accessible to residents.
Application in China: China could explore policies to regulate speculative investments in real estate and
ensure that housing remains primarily for living rather than speculative purposes.
6.4 Data Transparency and Market Monitoring
Canada's real estate market emphasizes transparency and data availability. The CMHC regularly publishes reports on housing market trends, mortgage conditions,
and economic factors affecting real estate. This data supports informed decision-making by policymakers, investors, and consumers.
Application in China: Enhancing data transparency and market
monitoring mechanisms could provide stakeholders with accurate and timely information, improving market predictability and stability.
6.5 Diverse Financing Options and Risk Management
Canadian real estate financing is characterized by diverse options, including fixed and variable mortgage rates, government-backed insurance for first-time buyers, and refinancing programs.
Strict lending criteria and stress tests ensure that buyers can afford mortgages even if interest rates rise.
Application in China: Developing diversified and sustainable financing options while
ensuring prudent lending practices can mitigate risks associated with property market defaults.
7 Conclusion
China's economy is in deflation, with GDP growth falling and residential property values falling. The downturn has been exacerbated by falling consumer confidence, posing a big challenge for a property sector that relies on high leverage and quick turnover of assets. The property sector, including well-known companies such as Vanke, is experiencing oversupply and low sales rates, threatening its financial stability. Vanke's financial position was initially considered sound, with liquid assets appearing to be sufficient to cover liabilities. But many of those assets are slow-moving inventories and receivables. Vanke's Quick Ratio, Return On Assert, and Net Profit Margin continue to decline,
its assets are difficult to liquidate, and its liquidity and actual valuation may overvalued, especially under the pressure of current market volatility and downward pricing.
The KMV model, which evaluates default risk based on asset value and its volatility, is obviously of limited efficacy when applied to the analysis of real estate companies. Due to the unique financial characteristics of real estate listed companies, the limitations of this model are expanded. These entrepreneurs typically have large liabilities and asset valuations are heavily influenced by industry-specific sales patterns, including large
upfront payments that are classified as contractual liabilities. This financial structure reduces the impact of share price movements on overall asset values, thus undermining the utility of the model to provide a true valuation for companies such as Vanke. The Z-score assesses Vanke's sensitivity to financial distress, indicating a possible miscalculation of the company's financial stability. Although assets ostensibly cover liabilities, the actual risk of default remains significant due to asset liquidity and potential overvaluation issues.
The broader economic downturn and specific challenges in the housing sector have exacerbated these concerns.
Vanke's financial difficulties reflect broader problems in China's real estate market. Many companies are facing problems such as huge amounts of unfinished projects, poor sales, a serious shortage of current assets and free cash flow, and difficulty in covering short-term financial expenses or loans.
This situation has led to widespread cash liquidity problems and an increased risk of insolvency. The real estate market recovery still faces huge challenges.